Metrics, logs and traces on one timeline, stored in your own cluster and read by your
browser directly. Your telemetry never passes through our servers.
OpenTelemetry in · Kubernetes · read-only MCP for your agents
Our own Poet, live
drag to zoom · double-click back
Reading our own Poet…
Your data stays home.
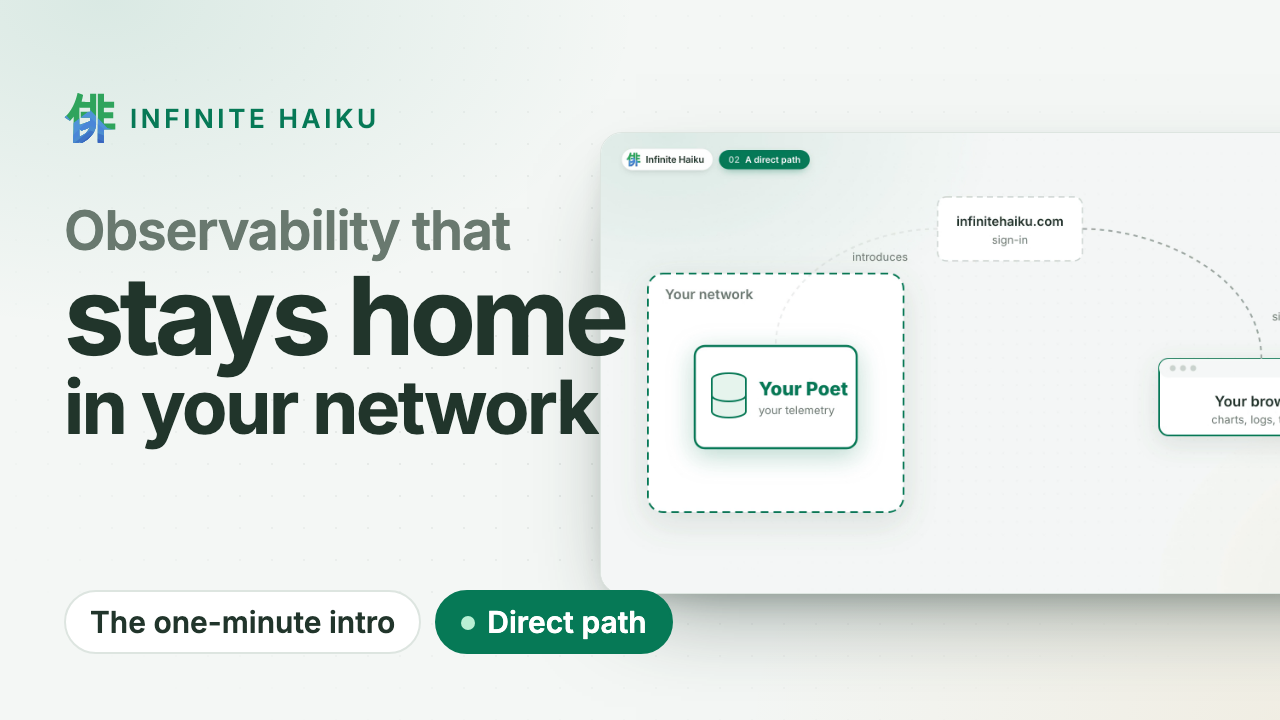
The datastore runs in your Kubernetes cluster or on your Linux machines. We sign you in and introduce your browser
to it; the data goes straight to you over an encrypted channel. No egress bill to ship telemetry
out, and nothing at our end to leak.
Walk into the timeline.
Every series of a service at once, drawn on your GPU. Zoom in and the detail follows; open a
request and see its log lines and the change behind it. Missing data is shown as missing, never
as zero.
Your agents investigate.
A read-only door (MCP) lets the coding agent you already use search, follow a request and read
the same numbers as your charts. No vendor AI, no per-investigation fee.
How it works
1A Poet in your cluster. Our datastore runs where your services run and
takes their OpenTelemetry. Read-only, one namespace.
2You sign in at infinitehaiku.com. Our web service checks who you are and
introduces your browser to your Poet. That is all it sees.
3Your browser talks to your Poet directly. An encrypted peer-to-peer
channel (WebRTC). The numbers never pass through our servers.
Infinite Haiku in one minute · plays from YouTube (youtube-nocookie.com)
Proof, not promises
Measured: 500,000 tasks from 200 workers over five hours, drawn at
1.1 ms of CPU per frame.
This site's own requests, live: the same public view you can give your customers.
Alerts in your network. Evaluated inside your own Poets.
Public status pages. Share a live dashboard without sharing access.
Kernel faults on the timeline. Memory errors, silent out-of-memory kills and disk errors, per node.
Flat CHF 5 per user account and month. Nothing per gigabyte, host or event.
Don't trust us: watch it yourself. Your Poet shows every connection and its bytes, peer to peer or to us. See how
Join the free pilot.
Expert help on your systems. Leave anytime: delete the Poet, one command.
Once we open to the public: two months free, then a flat CHF 5 per user account and month. How the pilot works ·
Security
Charts you can enter, alerts that stay in your network
agskabukialertsincidents
You can now enter every chart in Infinite Haiku, choose how it looks,
follow a request from a latency heatmap to its log lines, have alerts
evaluated inside your own network, and keep an incident as a document
whose evidence stays live. After rebuilding the foundations in mid-October
(a new Poet, the datastore that runs in your infrastructure, and a browser
app that talks to it directly), we wrote down every feature the design
asks for, row by row, and built the product back to it. Each row is
checked in a browser.
What the product does now
Every chart is a live AGS view. AGS is the graphics engine we have
designed and built by hand since April 2024. A chart in Infinite Haiku is
not a picture: move the cursor and a value tag follows it with the legend
at the cursor; click a band and the others step back while its details
open under the chart; zoom or pan time and every chart on the dashboard
follows. Turn the wheel over a band that has children (a node’s pods, a
pod’s containers) and you go down into that level. “Explore here” opens
the same scene in Explore. Missing data is drawn as missing, hatched,
never as a zero.
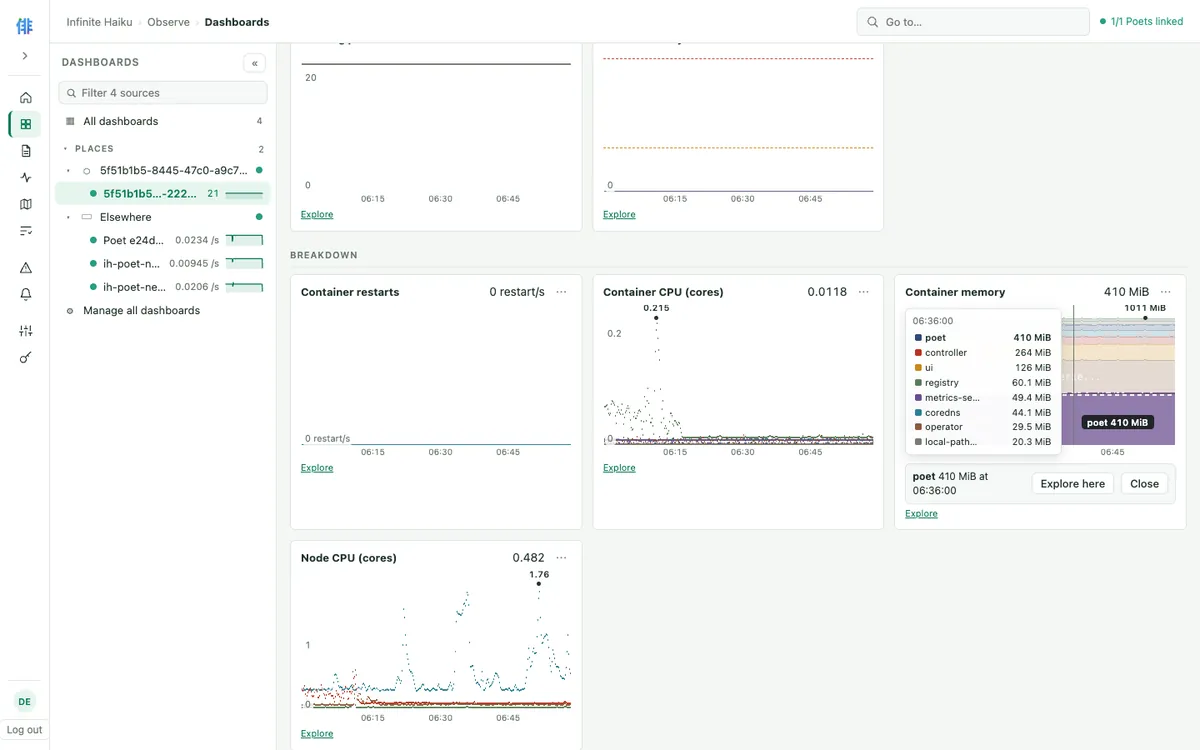
The poet band is selected at 06:36 on a container-memory chart;
“Explore here” opens the same scene.
Explore. One page to follow a question through your systems: pick a
metric, a level and a split, walk the element tree, read the series
table and the logs at the selected element, and move through time with a
navigator. Layers (markers, missing data, sub-elements, labels) are
switches kept in the page’s address, so a link you share opens the same
view.
Styles are your choice. The look of a chart is a setting, not our
taste imposed on you. Two palettes (washi earth and sumi ink wash); fills
that are opaque, translucent at the opacity you pick, ink wash with grain,
or lines only; outlines in the band’s colour, none, black or white
separators; a value tag, a legend or both at the cursor; labels on the
peaks or in the band. Each option is a separate choice, and an element
keeps its colour slot under both palettes.
Logs & Traces on live data. Infinite Haiku’s own services (the
Poets, the sign-in service and the app in your browser) now report their
traces, logs and metrics to the Poets, so a click in the app becomes one
trace from the browser to the Poet’s handler. Logs & Traces answers from
them: a latency heatmap where you draw a box, the trace waterfall, the log
stream with facets and patterns, a service map that names failing calls
by error class and calls that are slow but not failing, recent changes
and alarms, a live tail, saved searches, a side-by-side split and a
command palette. Every view pivots to the others, to Explore and to
Alerts at the same moment. More in
The request, the log line and the change, on one page.
Alerts evaluated in the Poets. Rules are stored in your Poets and
evaluated there, next to your data; the app only shows them. A rule that
fires draws its span on the chart, delivers to a webhook and opens an
incident. Your telemetry does not have to leave your network to be
watched.
Incidents are living documents. An incident is a document with live
evidence: a metric chart drawn by the same engine, the logs at that time,
the change markers of the window, and a check that shows a rule’s pass
or fail now. Pin it to the incident’s time, or reuse the same view an
hour, a day or a week earlier. Edits are revisioned. A good investigation
becomes a runbook attached to the rule that will fire next time, and
templates start a new document with its sections.
Your browser still reaches your Poets over a direct, encrypted WebRTC
channel. You need HTTPS to our site and nothing else: no VPN, no inbound
port, no access for us to your network. When a direct path is blocked, a
relay forwards packets it cannot read.
Why the design came first
Rather than add features until it felt right, on 2026-10-16 we
wrote a parity matrix: one row for every feature or interaction, with
what the agreed design asks for, what the previous product did, what the
new one does with evidence, the gap and its size. The agreed design is the
one we reached in four rounds of clickable mock-ups at the start of
October, after two and a half years of building AGS; Logs & Traces follow
their own design study. Where the design is silent, the previous product
is the reference. We went through the matrix and settled its open
questions before any code was written.
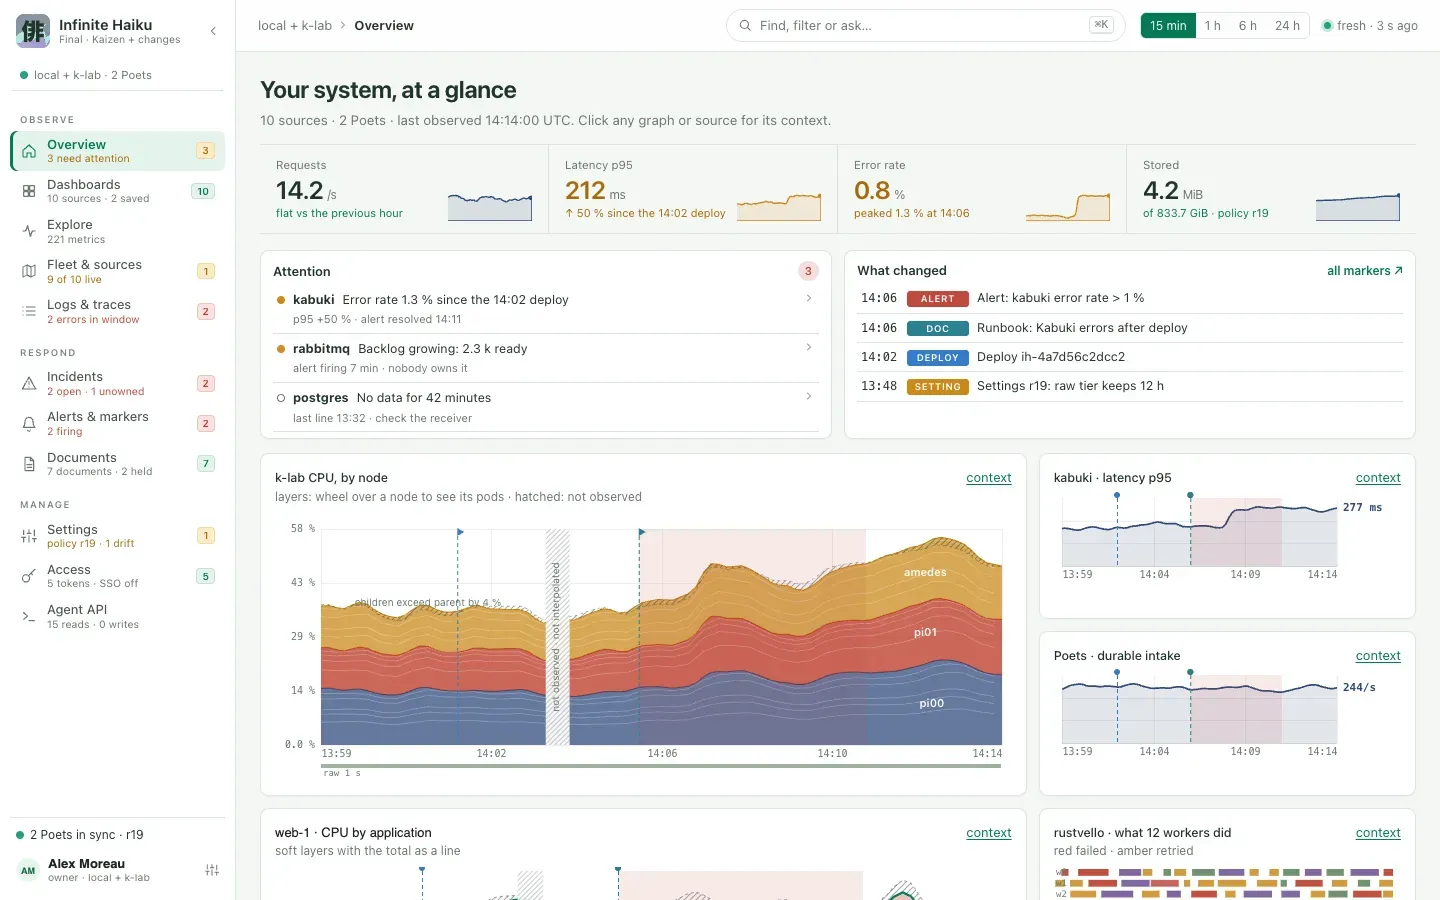
The design every page was compared with: the agreed Overview mock-up,
early October 2026.
The matrix then became the work: AI coding agents did the building, and
we judged each result against the design.
Of the 153 rows that describe the interface (the charts, Explore, Logs &
Traces, alerts and incidents, styles, the observing pages and the manage
pages), 121 now work, 21 work in part with the missing part named, 2 are
not started, 3 are deferred by decision and 6 wait for a product
decision (sign-up and invitations, for example). Each “works” names the browser
check that proves it.
How quality was kept
Seen, not assumed. Every change ran on its own isolated copy of the
product, with its own data, and was photographed page by page beside
the design. A difference from the design was a defect, not a matter of
taste.
Scripted browser checks. Each piece of work came with a script that
drives a real browser through its rows: open the page, click the band,
read the value, follow the pivot.
Tests run together. Finished work was merged two or three pieces at
a time and the whole test suite ran on the merge.
A regression check on the merged product. After each round, one
copy of the merged product ran every browser check. It caught what the
unit tests could not, including two chart interactions that worked on
their own but not together. They were fixed the same morning: in the
final check on the merged product, all 313 browser steps pass.
What is not done yet
Everything above was seen on local copies of the product; deploying it
to our lab cluster is the next check.
Panning and zooming stop at the time window already loaded; a finer
fetch while you zoom is next.
Alert delivery is webhook only; more channels come later, managed
centrally.
Incident documents cannot yet hold an AGS view, a trace or a dashboard
panel as a block, and nothing keeps an incident’s data past retention.
Dashboards for a single pod, node or process, and a global search, are
still to build.
What it means for you
You get the product as it was designed, not as it happened to come out:
charts you can question, a look you choose, alerts that stay inside your
network, and investigations that keep their evidence live. Each row of
that promise has a browser check behind it, and the checks run on every
change.
Follow the build here, or write to us if you want to run Infinite Haiku on your own systems as a pilot.
Welcome back
No account yet? Write to us: during the pilot we set up your organisation with you.