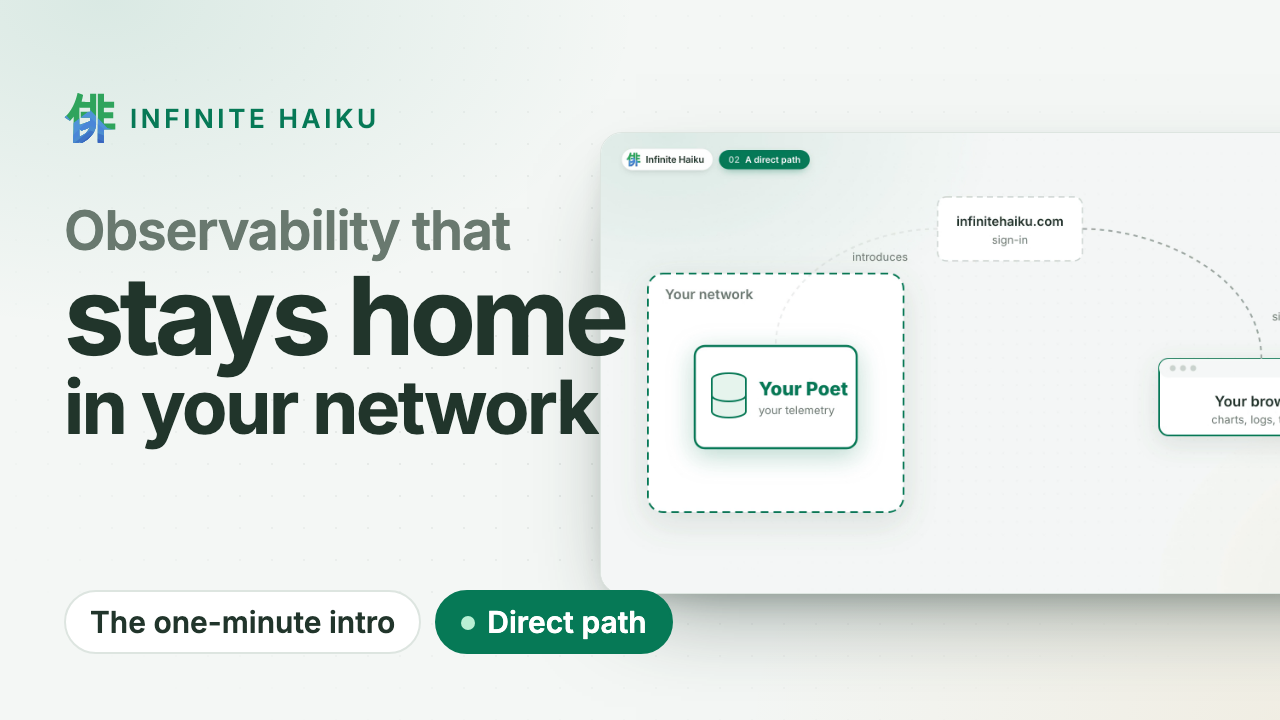
Metrics, logs and traces on one timeline, stored in your own cluster and read by your
browser directly. Your telemetry never passes through our servers.
OpenTelemetry in · Kubernetes · read-only MCP for your agents
Our own Poet, live
drag to zoom · double-click back
Reading our own Poet…
Your data stays home.
The datastore runs in your Kubernetes cluster or on your Linux machines. We sign you in and introduce your browser
to it; the data goes straight to you over an encrypted channel. No egress bill to ship telemetry
out, and nothing at our end to leak.
Walk into the timeline.
Every series of a service at once, drawn on your GPU. Zoom in and the detail follows; open a
request and see its log lines and the change behind it. Missing data is shown as missing, never
as zero.
Your agents investigate.
A read-only door (MCP) lets the coding agent you already use search, follow a request and read
the same numbers as your charts. No vendor AI, no per-investigation fee.
How it works
1A Poet in your cluster. Our datastore runs where your services run and
takes their OpenTelemetry. Read-only, one namespace.
2You sign in at infinitehaiku.com. Our web service checks who you are and
introduces your browser to your Poet. That is all it sees.
3Your browser talks to your Poet directly. An encrypted peer-to-peer
channel (WebRTC). The numbers never pass through our servers.
Infinite Haiku in one minute · plays from YouTube (youtube-nocookie.com)
Proof, not promises
Measured: 500,000 tasks from 200 workers over five hours, drawn at
1.1 ms of CPU per frame.
This site's own requests, live: the same public view you can give your customers.
Alerts in your network. Evaluated inside your own Poets.
Public status pages. Share a live dashboard without sharing access.
Kernel faults on the timeline. Memory errors, silent out-of-memory kills and disk errors, per node.
Flat CHF 5 per user account and month. Nothing per gigabyte, host or event.
Don't trust us: watch it yourself. Your Poet shows every connection and its bytes, peer to peer or to us. See how
Join the free pilot.
Expert help on your systems. Leave anytime: delete the Poet, one command.
Once we open to the public: two months free, then a flat CHF 5 per user account and month. How the pilot works ·
Security
The request, the log line and the change, on one page
logstracesincidentsagents
When something breaks, the answer is spread across three places: the
requests that failed, the log lines they wrote, and the change that went
out just before. Infinite Haiku now has one page for all three, Logs &
Traces. Its views can also be dropped into an incident report, by a person
or by an AI agent, and they stay live there. Before every merge we checked
its numbers against a design study’s own answers.
Why one page
An investigation usually starts with “something is wrong” and ends with
“this change did it”. In between, you jump between a latency chart, a list
of slow requests, one request’s spans, its log lines, and a deploy
history. Every jump costs you the context you had: the time window, the
service, the request you were looking at.
Logs & Traces keeps that context. One window, one filter bar and one
breadcrumb sit at the top. Below them, ten views (we call them lenses)
each answer one question about the same moment:
Roster: which services are not OK, and since when;
Changes: what was deployed or reconfigured, and did it hurt;
Alarms: what IH’s alerts said;
Heatmap: which requests were slow or failed;
Compare: what two or three requests have in common;
Path: where a route’s requests spend their time, and where they die;
Trace: one request, span by span;
Log board: one request’s log lines, in order;
Stream: every log line of the window;
Map: who calls whom, and which calls fail.
Pick a failed request in the heatmap and the trace opens on it. Press Esc
and you are back where you were. Copy the link and a colleague lands on
exactly the same view: the same window, the same box drawn on the
heatmap, the same requests picked.
The same views inside an incident report
An incident report is only as good as its evidence. In IH, every lens is
also a block you can put in an incident or on a dashboard. It is not a
screenshot: the block is the live view, drawn by the same code, so the
numbers in the report are the numbers on the page.
Agents can do this too. Through IH’s agent interface, an agent can open an
incident and add a heatmap of the bad window, the failed request’s trace
and its log stream. The person on call then reads a report whose evidence
they can click into. We tested exactly that: an incident built by an
agent, block by block, shows the same counts and rows as the page.
Poet does the arithmetic, your browser draws
IH’s datastore, Poet, runs in your infrastructure, next to your data.
Every number on this page comes from Poet: heatmap bins, percentiles,
the “did this change hurt” verdicts, log patterns, the Map’s layout.
Part of it is prepared when data arrives, so opening a view does not mean
scanning raw records. The browser only draws.
That matters for two reasons. The page stays fast as your volume grows,
because the work is done once, where the data already is. And the data
does not have to travel to a browser to be counted, so the footprint stays
small. How it behaves at production volume is still to measure; this
release was checked on a reference hour, not on millions of requests.
Checked against someone else’s answers
The design study came with its own synthetic hour of telemetry: 356
traces, 4,516 spans, 4,012 log lines and 4 changes, including a bad deploy
and its rollback. It also computed its own answers over that hour.
We loaded that hour into IH as ordinary OpenTelemetry data, then compared
IH’s answers with the study’s, family by family: 15 kinds of question,
from heatmap bins to the Map’s hover cards. Where IH disagreed, we looked
at why. Usually IH was wrong and we fixed it. Sometimes IH was right: the
study had left one service out of its list, and IH kept it. Wherever IH
knows less than the study pretended to (a team for a database, say), IH
shows nothing rather than a guess.
Every view also has a browser check that drives the page and asserts what
it shows. When the work merged, 448 of those assertions passed, plus 24
checks that compare a running Poet’s answers with the study’s. They now
run as one command, so a later change that breaks a view is caught before
it ships.
Judgement first, then speed
Years of design work made this fast, not a prompt. The product
underneath (the datastore, the graphics engine, the incident model) has
been designed and built by hand since 2024, and the design study for this
page went through several rounds of our review before any code. AI coding
agents then did the building, each owning its own part, and everything
was checked together before it merged.
We made the calls an agent cannot: where IH should differ from the study,
what counts as a job, where alarms come from, how the menu behaves. The
agents brought back evidence; we decided.
What is next
Poet is being rewritten, and Kabuki is becoming a browser-only app that
talks to Poet over a direct connection. The lenses stay as they are. The
study’s answers and the browser checks are now the tests the new Poet has
to pass before it replaces the old one.
If you run services and want this page on your own telemetry, follow the
build on this blog, or write to us about a pilot.
Welcome back
No account yet? Write to us: during the pilot we set up your organisation with you.