Metrics, logs and traces on one timeline, stored in your own cluster and read by your
browser directly. Your telemetry never passes through our servers.
OpenTelemetry in · Kubernetes · read-only MCP for your agents
Our own Poet, live
drag to zoom · double-click back
Reading our own Poet…
Your data stays home.
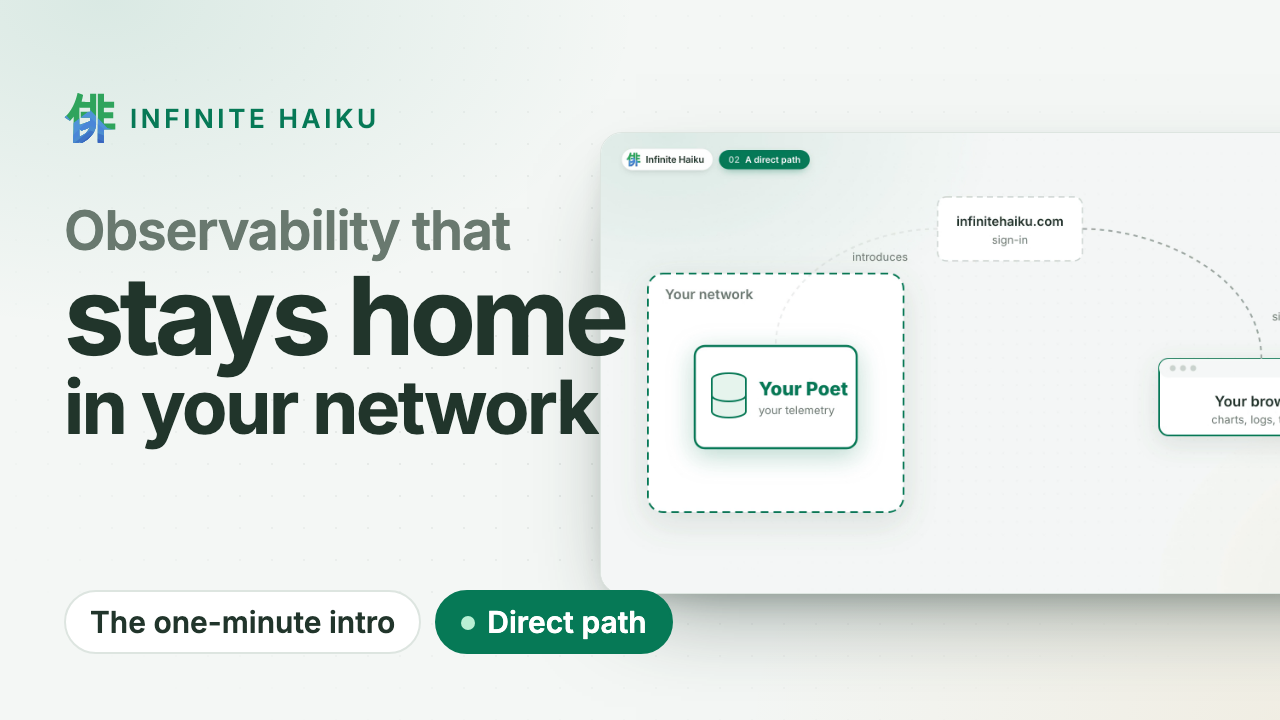
The datastore runs in your Kubernetes cluster or on your Linux machines. We sign you in and introduce your browser
to it; the data goes straight to you over an encrypted channel. No egress bill to ship telemetry
out, and nothing at our end to leak.
Walk into the timeline.
Every series of a service at once, drawn on your GPU. Zoom in and the detail follows; open a
request and see its log lines and the change behind it. Missing data is shown as missing, never
as zero.
Your agents investigate.
A read-only door (MCP) lets the coding agent you already use search, follow a request and read
the same numbers as your charts. No vendor AI, no per-investigation fee.
How it works
1A Poet in your cluster. Our datastore runs where your services run and
takes their OpenTelemetry. Read-only, one namespace.
2You sign in at infinitehaiku.com. Our web service checks who you are and
introduces your browser to your Poet. That is all it sees.
3Your browser talks to your Poet directly. An encrypted peer-to-peer
channel (WebRTC). The numbers never pass through our servers.
Infinite Haiku in one minute · plays from YouTube (youtube-nocookie.com)
Proof, not promises
Measured: 500,000 tasks from 200 workers over five hours, drawn at
1.1 ms of CPU per frame.
This site's own requests, live: the same public view you can give your customers.
Alerts in your network. Evaluated inside your own Poets.
Public status pages. Share a live dashboard without sharing access.
Kernel faults on the timeline. Memory errors, silent out-of-memory kills and disk errors, per node.
Flat CHF 5 per user account and month. Nothing per gigabyte, host or event.
Don't trust us: watch it yourself. Your Poet shows every connection and its bytes, peer to peer or to us. See how
Join the free pilot.
Expert help on your systems. Leave anytime: delete the Poet, one command.
Once we open to the public: two months free, then a flat CHF 5 per user account and month. How the pilot works ·
Security
We rebuilt the Poet so your data never leaves your network
poetwebrtc
The Poet is the part of Infinite Haiku that runs next to your systems and
keeps their telemetry. We have rebuilt it on a design that took a year and
a half of hands-on work to arrive at. The new Poet stores everything in
standard formats, answers with exact numbers, and talks to your browser
directly. Our servers only introduce the two; your data never passes
through them.
What changes for you
Your data stays with you. Your browser opens a direct, encrypted
WebRTC channel to your own Poet. Every chart, log line and trace travels
over that channel. Our servers handle sign-in and introductions only. When
a direct path is blocked, a relay forwards encrypted packets it cannot
read.
Numbers you can trust. Averages, percentiles and counter rates are
computed exactly, not estimated. Older data is rolled up into 10-second,
1-minute and 10-minute summaries. A chart read from those summaries is
byte-for-byte the same as the chart read from the raw data. When a
counter restarts, the rate stays correct. A missing value is shown as
missing, never as zero.
Retries never double count. A collector that resends an export, or
splits it differently the second time, no longer stores anything twice.
Every span, log line and metric point is checked on its own. The check
costs about 3 to 5 percent of intake time.
Standard formats, small footprint. The Poet keeps your data in open,
columnar formats that the whole industry can read, compressed on disk.
It runs inside your infrastructure, so we keep it lean: it watches its own
memory and refuses work it cannot afford instead of falling over.
Faster pages. The app now loads only what the first page needs: about
190 KB compressed. Each other page loads the first time you open it.
Your AI agent works locally. An agent such as Claude reaches your
Poets through a small program on your own machine, with your own
permissions. It answers from the same exact numbers you see.
How we built it
The design is the slow part, and it is ours: the views in AGS have been
designed and hand-built since April 2024, and the Poet’s rules come from
running the old one. We first wrote down what the old Poet did for its
users: 19 checks, from “sign-in works” to “the dashboard numbers equal a
reference hour”. Then AI coding agents rebuilt each part in parallel
against those checks, and we reviewed, merged and tested every change
together.
Every change passed the tests of everything else before it could merge.
A browser check now drives the whole new system, from sign-in to every
page: 146 of its 150 steps pass, and the last four are being fixed.
Running the old and new Poet side by side found real bugs:
duplicates after a regrouped retry (a new-Poet bug, caught and fixed
before it shipped);
graph deliveries counted twice under a new id (the old Poet has the same
flaw; the new one does not);
summaries that were not exact (the old Poet’s known bug; the new one is
exact by test).
What is next
The new system runs on our development machines and passes its checks.
Next it moves to our own cluster. There we will measure its memory, CPU
and disk on real traffic (to measure) before it replaces the old Poet.
Want to try it on your own systems first? Ask us for a pilot.
Welcome back
No account yet? Write to us: during the pilot we set up your organisation with you.