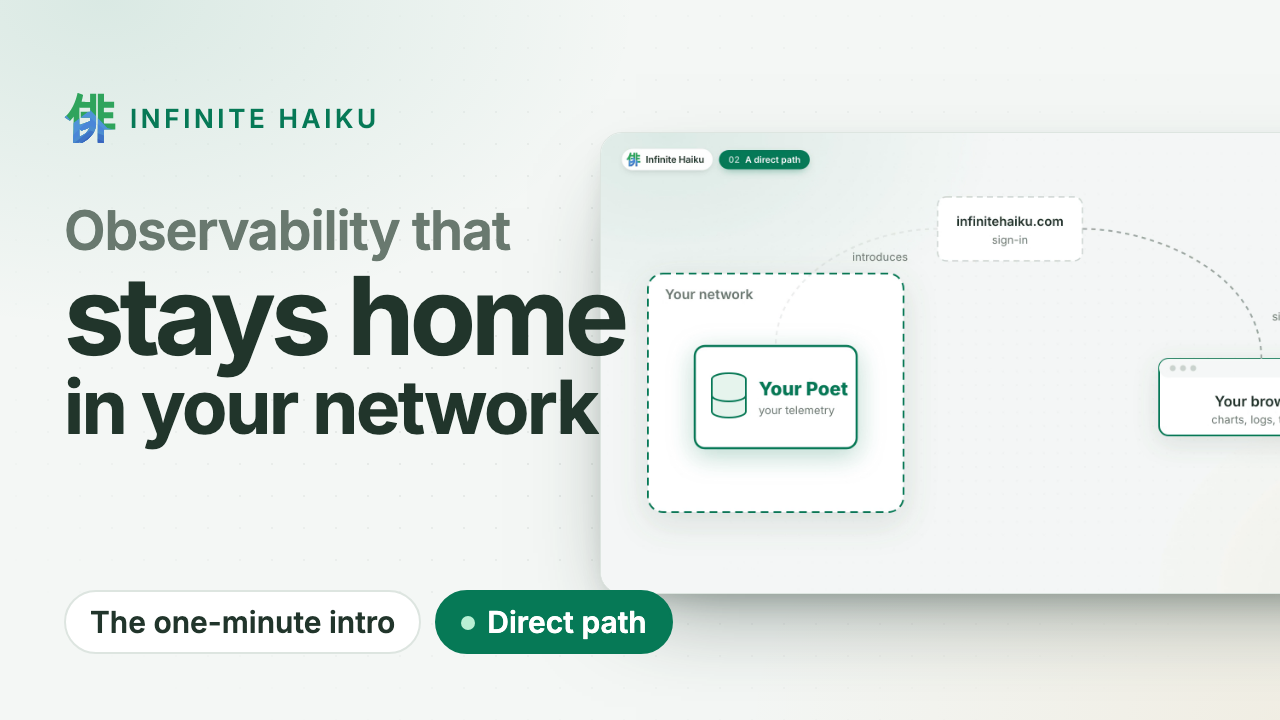
Metrics, logs and traces on one timeline, stored in your own cluster and read by your
browser directly. Your telemetry never passes through our servers.
OpenTelemetry in · Kubernetes · read-only MCP for your agents
Our own Poet, live
drag to zoom · double-click back
Reading our own Poet…
Your data stays home.
The datastore runs in your Kubernetes cluster or on your Linux machines. We sign you in and introduce your browser
to it; the data goes straight to you over an encrypted channel. No egress bill to ship telemetry
out, and nothing at our end to leak.
Walk into the timeline.
Every series of a service at once, drawn on your GPU. Zoom in and the detail follows; open a
request and see its log lines and the change behind it. Missing data is shown as missing, never
as zero.
Your agents investigate.
A read-only door (MCP) lets the coding agent you already use search, follow a request and read
the same numbers as your charts. No vendor AI, no per-investigation fee.
How it works
1A Poet in your cluster. Our datastore runs where your services run and
takes their OpenTelemetry. Read-only, one namespace.
2You sign in at infinitehaiku.com. Our web service checks who you are and
introduces your browser to your Poet. That is all it sees.
3Your browser talks to your Poet directly. An encrypted peer-to-peer
channel (WebRTC). The numbers never pass through our servers.
Infinite Haiku in one minute · plays from YouTube (youtube-nocookie.com)
Proof, not promises
Measured: 500,000 tasks from 200 workers over five hours, drawn at
1.1 ms of CPU per frame.
This site's own requests, live: the same public view you can give your customers.
Alerts in your network. Evaluated inside your own Poets.
Public status pages. Share a live dashboard without sharing access.
Kernel faults on the timeline. Memory errors, silent out-of-memory kills and disk errors, per node.
Flat CHF 5 per user account and month. Nothing per gigabyte, host or event.
Don't trust us: watch it yourself. Your Poet shows every connection and its bytes, peer to peer or to us. See how
Join the free pilot.
Expert help on your systems. Leave anytime: delete the Poet, one command.
Once we open to the public: two months free, then a flat CHF 5 per user account and month. How the pilot works ·
Security
A monitoring graph makes claims: this is how busy the machine was, this is
what nothing looked like, these parts add up to that whole. If those claims
are wrong, you make decisions on a picture of a system you do not have. We
got several of them wrong in Infinite Haiku and fixed them. This post
covers four: why a process at 400% CPU can be correct, why missing data
must never be drawn as zero, why a stacked chart needs exactly one additive
parent, and how one metric turned into a menu entry per container.
Infinite Haiku’s timeline renderer, AGS, draws hierarchical systems as stacked
areas over time: a host, its application groups, applications and processes;
a cluster, its nodes, pods and containers. Stacking is powerful because it
lets you see a whole and its parts at once. It is also easy to make it lie.
400% is not a bug
A user looked at a laptop in AGS and saw a process at 400% CPU. The laptop
was not over capacity. The number was in core percent: 100% means one
logical CPU fully busy, so 400% means four. That is the convention of the
sysinfo crate our macOS Muse uses.
Core percent is a perfectly good unit, but it is a bad default for a stacked
host view. The reader’s question is usually “how much of this machine is being
used?”, and the answer to that has a different denominator. So the macOS Muse
now reports two process CPU metrics:
process.cpu.capacity_percent, the default: core percent divided by the
number of logical CPUs, so 100% is the whole machine;
process.cpu.usage_percent, shown as “Process CPU (core %)”, unchanged. Its
history is not reinterpreted.
Two caveats are spelled out rather than hidden. Logical CPUs are weighted
equally, although performance and efficiency cores do not do the same work.
And the sum of collected processes need not equal host busy CPU, because some
processes are not visible to the collector. A stacked view can show the gap
as an explicit remainder; it must not rescale the children until they fit.
Missing is not zero
If the capacity cannot be computed because the logical CPU count is unknown,
the Muse emits no measurement, not a zero. This sounds small and is the
rule we break most easily.
A gap in telemetry can mean many things: the collector was slow, the source
was unavailable, the query has not loaded yet, the data aged out of the
retained tier, or the process really was idle. Only the last one is a zero.
Drawing the others as zero invents a measurement and, worse, one that looks
reassuring. A crash-looping container that reports no CPU is not using 0%
CPU.
So we keep the distinction all the way through:
Coarse queries return the mean of observed samples, with the observed
minimum and maximum, the observed count, and the expected count. Missing
samples are left out of the mean, not averaged in as zeros.
With partial coverage, a stacked area shows the known contribution per
expected sample, and the summary reports coverage separately.
AGS distinguishes “Loading” from a confirmed “No observation” band, and
both from a measured zero, which is valid coverage.
A short-gap connector is drawn dashed and unfilled, and never extends what
the query claims to cover.
We do not hold the last value indefinitely.
Our tests must distinguish missing data from measured zero, and the
dashboards follow the same rule: measured zero, no data and “not reported”
are three different states.
Stacking needs one additive parent
A stack says “these parts sum to that whole”. That is only true for one
disjoint partition at a time. A container belongs to a pod, which belongs to a
node, and also to a Deployment and a namespace. Those are different
partitions of the same CPU. Stack a container under two parents and you count
it twice.
AGS therefore stacks along exactly one additive hierarchy at a time and shows
the others as alternative views or relationship overlays. The same rule
applies to units:
percentages can be added only when every child shares a denominator; core
percent from a four-core host and a sixteen-core host do not add up;
process RSS includes shared memory, so summing it is not host memory in use;
latency quantiles cannot be summed, and averages cannot be averaged without
their counts;
a trace tells you which tasks ran in a process, not how its CPU divides
between them, so we never attribute process CPU to spans by duration and
call it measured.
When readings disagree, we show the disagreement, for example as an
“unattributed” or “shared” remainder. Silent rescaling makes inconsistent data
look correct, which is the one thing a monitoring tool must not do.
One metric, one menu entry
The Kubernetes version of these bugs was a menu. Kabuki’s metric menu showed
one CPU entry per container instead of a single “CPU” with containers, pods,
nodes and the cluster underneath.
The cause: the Kubernetes Muse described the container inside the metric’s
description, and the menu treated every distinct description as a distinct
metric. Our checks confirmed that samples existed, which they did. Nothing
checked that one metric appeared once with many entities below it.
The fix had three parts: the Muse emits stable metric descriptions (the
live cluster now reports shared k8s.cpu.usage and k8s.memory.usage
metrics), metrics are identified by their meaning rather than their full
description, and an offline regression test catches the split before
anything is deployed. Every Muse now needs a fast contract test that checks
metric identity, entity identity, hierarchy and menu grouping. “There is
data” is not the same as “the data has the right shape”.
The common thread
Each of these was a graph that looked plausible and meant something else.
Honest graphs come from a few boring rules applied everywhere: name the
denominator, keep missing separate from zero, stack along one partition, and
test the shape of the data as well as its existence. For you, that means a
graph you can act on without first asking what it is hiding.
Follow the build on this blog, or ask us for a pilot if you want graphs like these on your own systems.
Welcome back
No account yet? Write to us: during the pilot we set up your organisation with you.