Infinite Haiku

Observability that stays in your network.

Metrics, logs and traces on one timeline, stored in your own cluster and read by your browser directly. Your telemetry never passes through our servers.

OpenTelemetry in · Kubernetes · read-only MCP for your agents
Our own Poet, live

drag to zoom · double-click back

Reading our own Poet…

Your data stays home.

The datastore runs in your Kubernetes cluster or on your Linux machines. We sign you in and introduce your browser to it; the data goes straight to you over an encrypted channel. No egress bill to ship telemetry out, and nothing at our end to leak.

Walk into the timeline.

Every series of a service at once, drawn on your GPU. Zoom in and the detail follows; open a request and see its log lines and the change behind it. Missing data is shown as missing, never as zero.

Your agents investigate.

A read-only door (MCP) lets the coding agent you already use search, follow a request and read the same numbers as your charts. No vendor AI, no per-investigation fee.

How it works

  1. 1A Poet in your cluster. Our datastore runs where your services run and takes their OpenTelemetry. Read-only, one namespace.
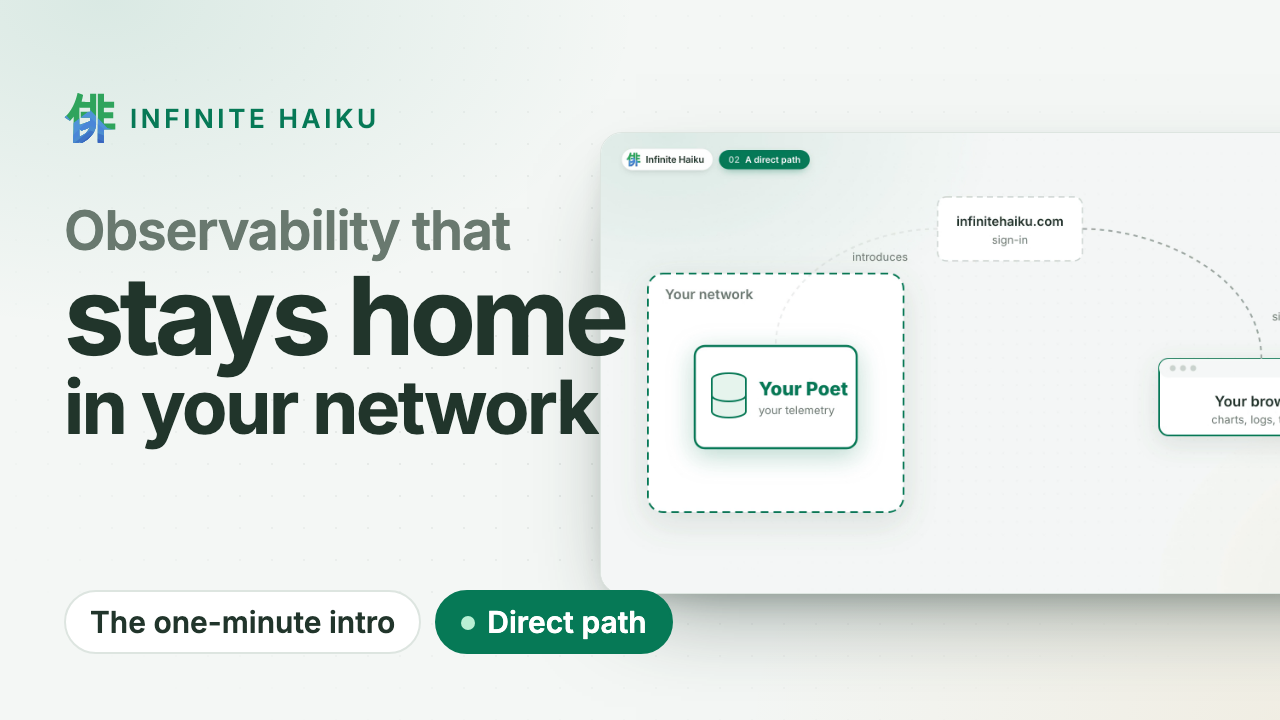
  2. 2You sign in at infinitehaiku.com. Our web service checks who you are and introduces your browser to your Poet. That is all it sees.
  3. 3Your browser talks to your Poet directly. An encrypted peer-to-peer channel (WebRTC). The numbers never pass through our servers.
Your browser signs in at infinitehaiku.com, which introduces it to the Poet in your network; the data then goes directly between the Poet and your browser. Your network Your services OpenTelemetry Poet your datastore Your browser dashboards, AGS infinitehaiku.com sign-in, introduction your telemetry, encrypted, direct never through our servers
Infinite Haiku in one minute · plays from YouTube (youtube-nocookie.com)

Proof, not promises

Measured: 500,000 tasks from 200 workers over five hours, drawn at 1.1 ms of CPU per frame.

This site's own requests, live: the same public view you can give your customers.

This site's own requests, live · open it full size

Who is behind it

An independent team. You talk to the people who build it.

No sales layer between your questions and the answers.

Built since April 2024. Bootstrapped: no venture capital, no board, no hyperscaler lock-in. About us

  • Alerts in your network. Evaluated inside your own Poets.
  • Public status pages. Share a live dashboard without sharing access.
  • Kernel faults on the timeline. Memory errors, silent out-of-memory kills and disk errors, per node.
  • Flat CHF 5 per user account and month. Nothing per gigabyte, host or event.
  • Don't trust us: watch it yourself. Your Poet shows every connection and its bytes, peer to peer or to us. See how

Join the free pilot.

Expert help on your systems. Leave anytime: delete the Poet, one command. Once we open to the public: two months free, then a flat CHF 5 per user account and month. How the pilot works · Security

Write to us
← Docs

How long your data is kept

Your data lives in your Poets, on your own disks. Each kind of data is kept for a set time, and a Poet also has a disk limit it never passes. You change both in Settings › Retention and disk; each setting shows, right beside it, how much that kind of data takes now, how far back it reaches and how it has grown over the last days.

What is kept, and for how long

DataKeptThen
Log lines7 daysgone, a whole hour at a time
Traces (spans)7 daysgone, a whole hour at a time
Metrics at full detail2 dayscharts read the same metrics at 10 s, 1 min and 10 min steps
Metrics at 10 s, 1 min and 10 minuntil the disk needs the roomthe finest step goes first, so the longest history survives
Deploys and other changesuntil the disk needs the room
Dashboards, incidents, settingsalwaysnever expired

A week of logs and traces matches how long an incident keeps its full detail, so last week reads the same whether or not an incident was open. Expired data cannot be brought back, not even by rolling a setting back.

The disk limit

A Poet uses at most its disk limit: what you set in Most disk per Poet (or POET_DISK_LIMIT when you install it), else its own data plus the free space left on its volume. When it passes 90 % of the limit, it frees room until it is back at 80 %, oldest first, in this order:

  1. metrics at full detail that are already kept at 10 s;
  2. log lines and traces;
  3. other metrics at full detail;
  4. metrics at 10 s, then at 1 min, then at 10 min;
  5. deploys and other changes.

Dashboards, incidents and your settings are never removed to make room. Both percentages are settings too. A volume shared with other programs that fill it makes the Poet give back a share of its oldest data, never all of it.

Seeing it

Each Poet reports what it keeps, as part of its own dashboard (“This Poet” › Storage): the disk and memory each kind of data takes, how far back each reaches, the disk limit, and what was removed and why (its age, or the disk limit).