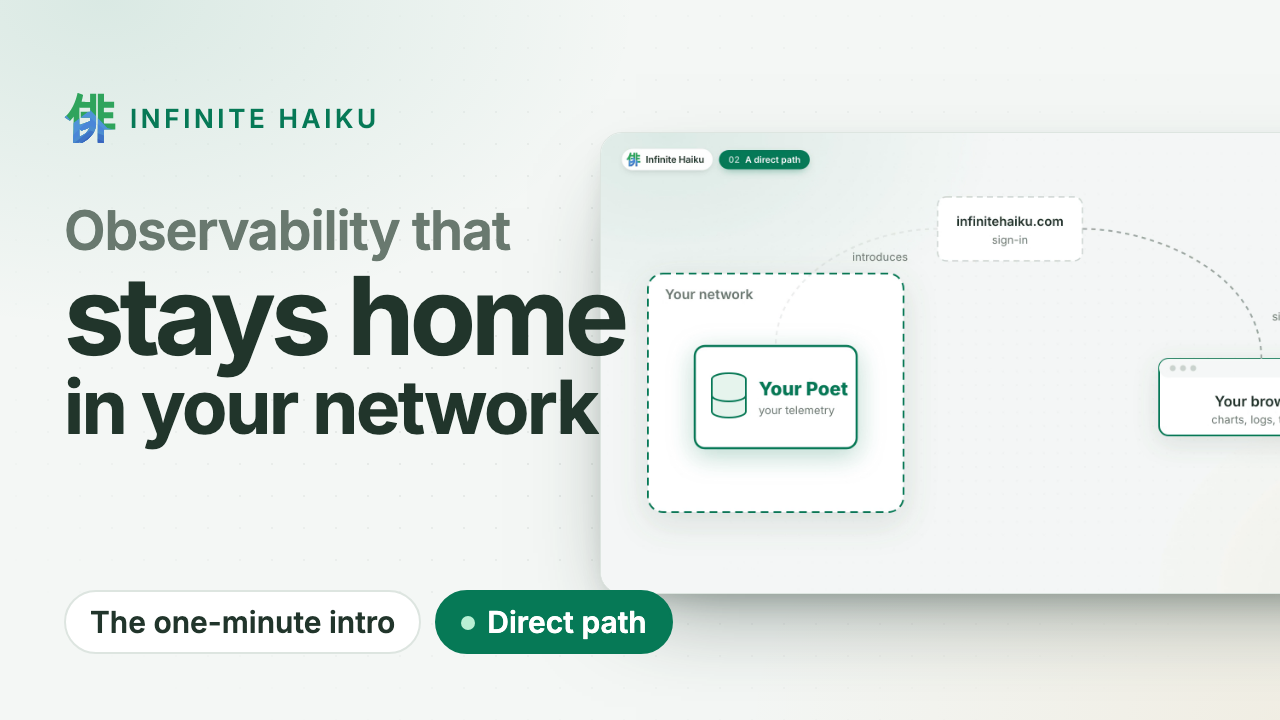
Metrics, logs and traces on one timeline, stored in your own cluster and read by your
browser directly. Your telemetry never passes through our servers.
OpenTelemetry in · Kubernetes · read-only MCP for your agents
Our own Poet, live
drag to zoom · double-click back
Reading our own Poet…
Your data stays home.
The datastore runs in your Kubernetes cluster or on your Linux machines. We sign you in and introduce your browser
to it; the data goes straight to you over an encrypted channel. No egress bill to ship telemetry
out, and nothing at our end to leak.
Walk into the timeline.
Every series of a service at once, drawn on your GPU. Zoom in and the detail follows; open a
request and see its log lines and the change behind it. Missing data is shown as missing, never
as zero.
Your agents investigate.
A read-only door (MCP) lets the coding agent you already use search, follow a request and read
the same numbers as your charts. No vendor AI, no per-investigation fee.
How it works
1A Poet in your cluster. Our datastore runs where your services run and
takes their OpenTelemetry. Read-only, one namespace.
2You sign in at infinitehaiku.com. Our web service checks who you are and
introduces your browser to your Poet. That is all it sees.
3Your browser talks to your Poet directly. An encrypted peer-to-peer
channel (WebRTC). The numbers never pass through our servers.
Infinite Haiku in one minute · plays from YouTube (youtube-nocookie.com)
Proof, not promises
Measured: 500,000 tasks from 200 workers over five hours, drawn at
1.1 ms of CPU per frame.
This site's own requests, live: the same public view you can give your customers.
Alerts in your network. Evaluated inside your own Poets.
Public status pages. Share a live dashboard without sharing access.
Kernel faults on the timeline. Memory errors, silent out-of-memory kills and disk errors, per node.
Flat CHF 5 per user account and month. Nothing per gigabyte, host or event.
Don't trust us: watch it yourself. Your Poet shows every connection and its bytes, peer to peer or to us. See how
Join the free pilot.
Expert help on your systems. Leave anytime: delete the Poet, one command.
Once we open to the public: two months free, then a flat CHF 5 per user account and month. How the pilot works ·
Security
A public dashboard shows a few chosen panels to anyone with the link,
without an account: our own demo, or your service’s status page, the way
large providers publish their availability.
The demo
The Demo button on our home page opens the public profile “demo” of
our own organisation: the app itself, read-only, on our own servers, read
through the same path a customer uses. Its menu is the app’s; what the
profile does not show is greyed out (“not in this public view”). Its
dashboard, live, inside this page:
Beyond charts, a public view can show the newest requests of a site (route,
service, duration, status, when it started) and an AGS band of the
dashboard’s parts, each computed once per refresh for every visitor. Our
own site’s recent requests, including yours:
The server this site runs on, a Linux host its Muse reads: CPU and memory
per systemd unit (each band a unit), and its processes by memory. A
hover reads every unit at that moment:
Publish the panels that answer “is it up, and is it fast?” (availability,
error rate, latency) for your customers to check before they open a ticket.
Link to it or embed it in your own site.
How it works
A public profile. An admin of your organisation creates a named
profile (for example “status”), picks the dashboards and the panels it
shows, how far back a visitor may look, and how often it refreshes.
An organisation can have several.
What it enables. A profile’s pages are the parts of the app it
enables: dashboards, Logs & Traces views (Requests, Trace, Request
logs, Logs, Services, Map) over the services you name, and the
incident list. The visitor gets the app’s menu with the rest
disabled, and no account, settings or editing. Or choose one page,
no menu for an availability or incident page.
Preview, then publish. The admin views the profile exactly as the
public will, then publishes it. Publishing freezes a copy: later edits
to the dashboards go public only when an admin publishes again.
Publishing needs the admin role.
The address./p/<organisation>/<profile>. Embedding in a page of
yours is allowed only from the sites you list in the profile.
The anonymous view. A visitor gets a short-lived, read-only public
grant for that profile and nothing else, and reads it over the same
direct channel to your Poet as a signed-in user. A signed-in admin who
opens the address sees the public view, marked “viewing as public”,
never with their own rights.
Embed it in your site
List your site’s origin (for example https://status.example.com) in the
profile’s embedding sites, then put the view in a page:
Without embed=1 the frame holds the whole public app; its links stay
inside the frame and never navigate your page. embed=1 shows one page,
compact. Add dashboard=<id> or panel=<id> to show one dashboard or
one panel. These only choose what is shown; what may be read is still
the profile’s.
What the public can and cannot see
The public can
The public cannot
the published panels of that profile
any other dashboard, panel or profile
the time range the profile allows
further back than that range
refreshed answers, at the profile’s pace
Explore, or queries of their own
a request listed in the profile’s current answers, opened in Trace (spans: service, operation, times, status)
any other request, or another profile’s
that request’s log lines, only if the profile enables Request logs
attributes, hosts or resource fields of spans and lines
sign in, change anything, or see who else is looking
Panels can name hosts, pods and services: check the preview before you
publish.
Mask names you keep private
A profile’s Masked names list hides names in everything the public
sees: panel titles, legends, process and unit lists, requests, traces and
log lines. One pattern per line:
Pattern
Hides
vpn-agent
any name containing it
*.internal.example.com
whole host names that match
re:^10\.
names matching a regular expression
Your Poet replaces each match before the answer leaves it, so the real
name never reaches a visitor’s browser. The visitor sees a pill such as
masked·b12f: the same name always gets the same code, so charts still
tell series apart, and the code cannot be guessed back. Changes apply on
save, without publishing again. Our own demo uses it for our VPN and
private host names.
Limits
Your Poet enforces these, not the browser:
Compute once, serve many. Every visitor of a profile gets the same
answer, computed once per refresh, so a busy status page does not become
load on your Poet. Opening one request reads only that request, and
only when the profile’s current answer lists it.
Caps on concurrent public sessions per Poet and per profile, and
rate limits where public grants are issued; signed-in users are never
starved.
A bandwidth cap per profile on the relay used when a direct
connection is not possible.
Opt-in per Poet. A Poet serves public visitors only when you enable
it. Public grants have their own signing key; revoking a profile ends its
sessions within 15 minutes. Public sessions are counted and logged.
Welcome back
No account yet? Write to us: during the pilot we set up your organisation with you.