Metrics, logs and traces on one timeline, stored in your own cluster and read by your
browser directly. Your telemetry never passes through our servers.
OpenTelemetry in · Kubernetes · read-only MCP for your agents
Our own Poet, live
drag to zoom · double-click back
Reading our own Poet…
Your data stays home.
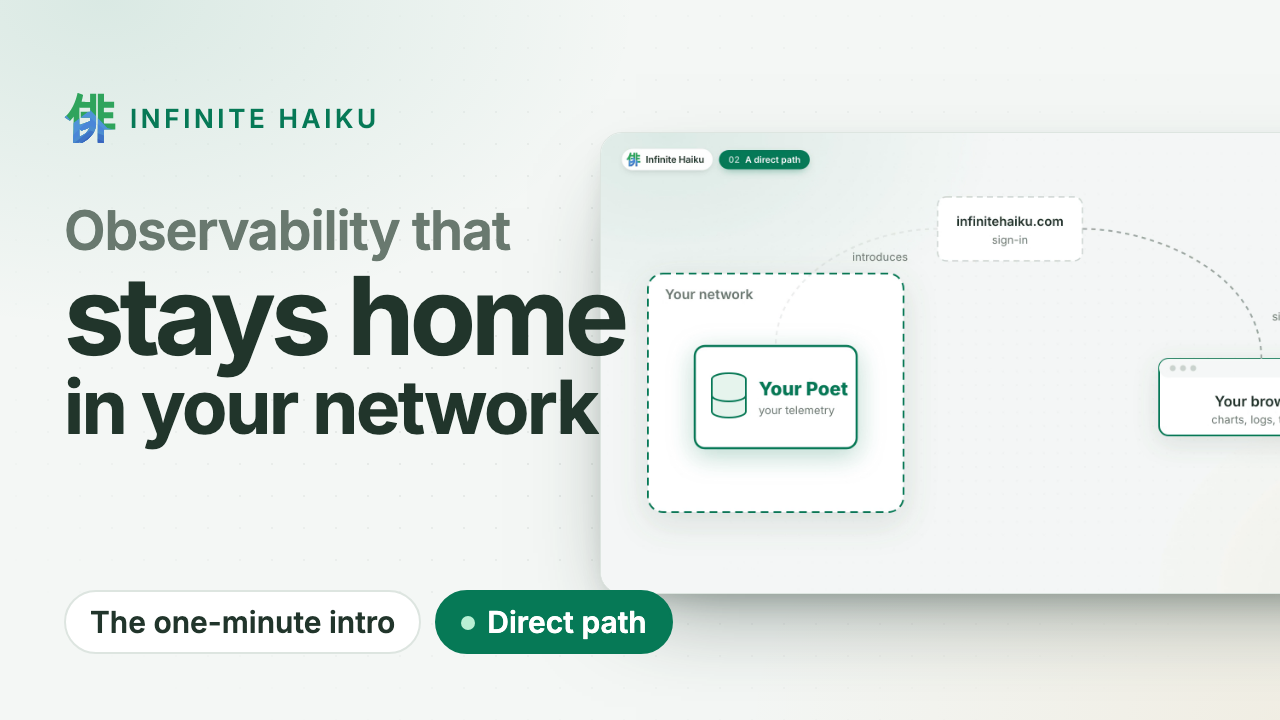
The datastore runs in your Kubernetes cluster or on your Linux machines. We sign you in and introduce your browser
to it; the data goes straight to you over an encrypted channel. No egress bill to ship telemetry
out, and nothing at our end to leak.
Walk into the timeline.
Every series of a service at once, drawn on your GPU. Zoom in and the detail follows; open a
request and see its log lines and the change behind it. Missing data is shown as missing, never
as zero.
Your agents investigate.
A read-only door (MCP) lets the coding agent you already use search, follow a request and read
the same numbers as your charts. No vendor AI, no per-investigation fee.
How it works
1A Poet in your cluster. Our datastore runs where your services run and
takes their OpenTelemetry. Read-only, one namespace.
2You sign in at infinitehaiku.com. Our web service checks who you are and
introduces your browser to your Poet. That is all it sees.
3Your browser talks to your Poet directly. An encrypted peer-to-peer
channel (WebRTC). The numbers never pass through our servers.
Infinite Haiku in one minute · plays from YouTube (youtube-nocookie.com)
Proof, not promises
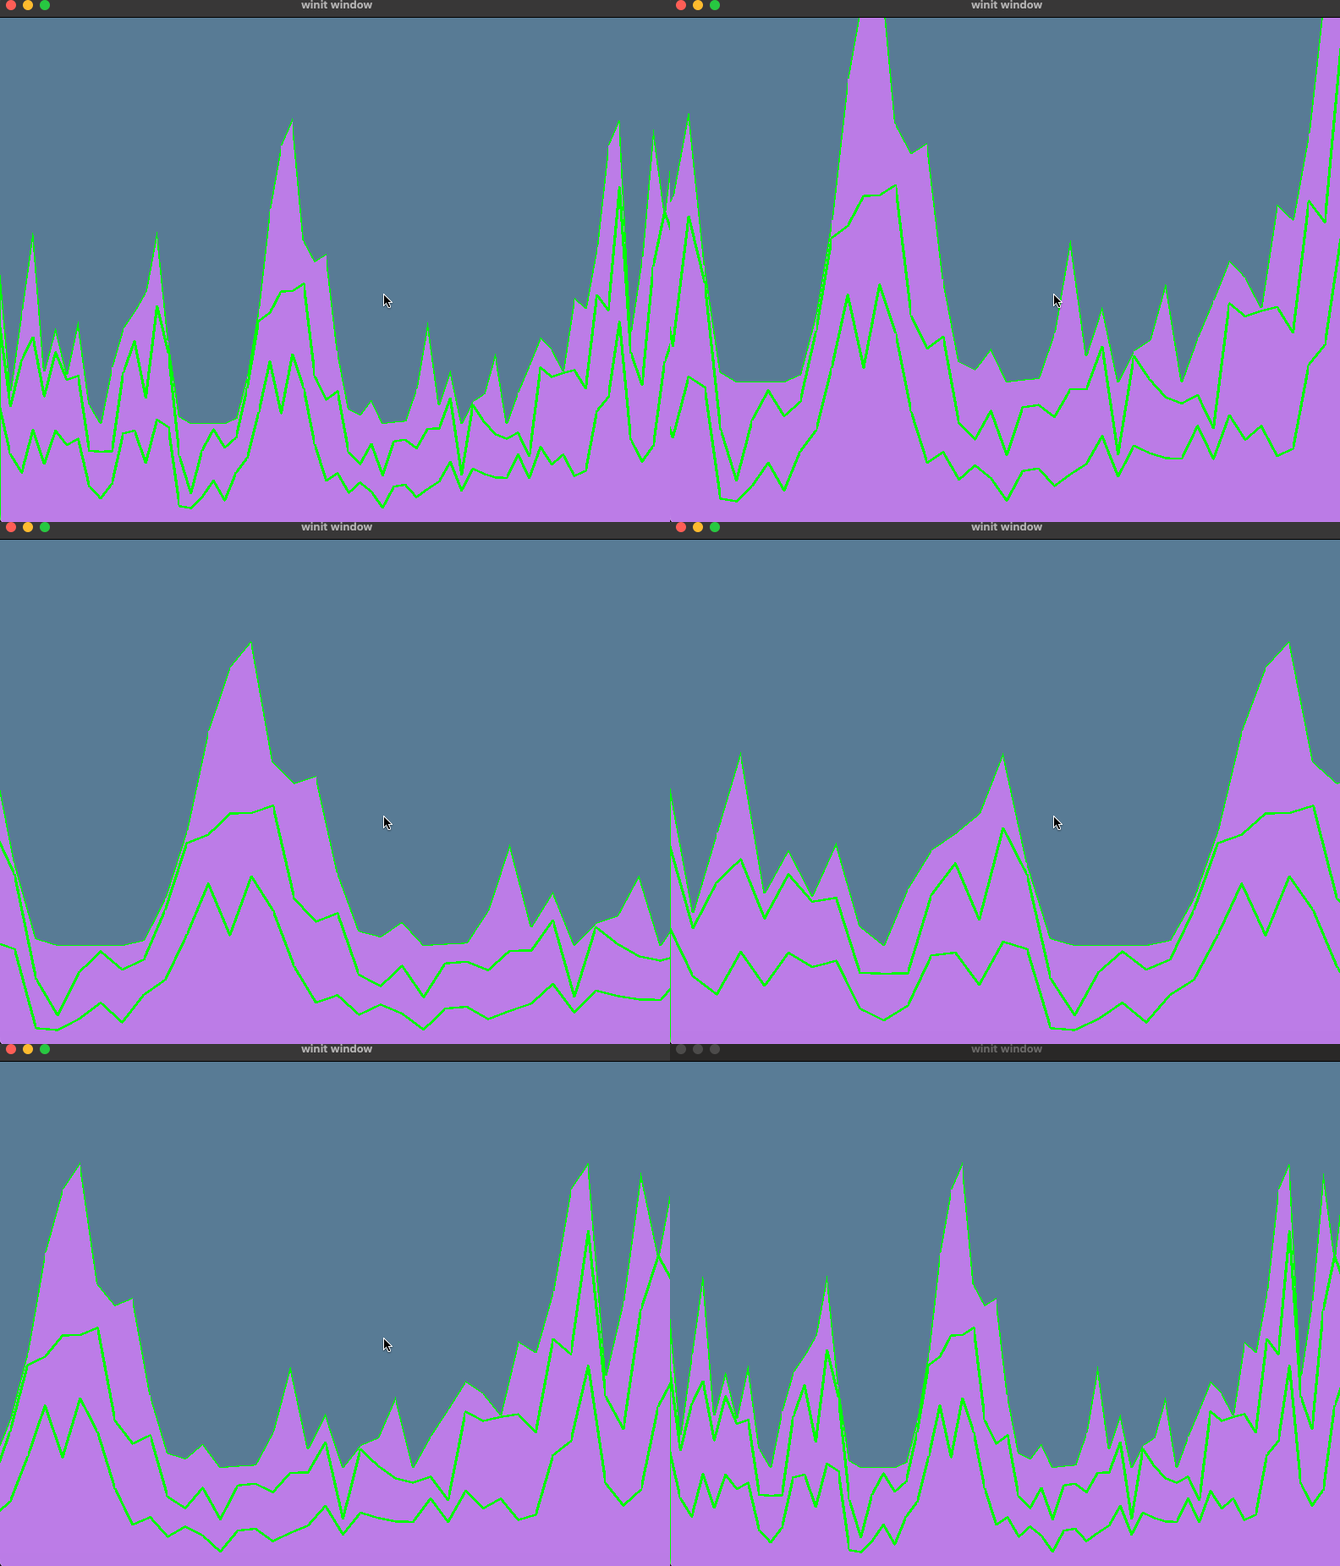
Measured: 500,000 tasks from 200 workers over five hours, drawn at
1.1 ms of CPU per frame.
This site's own requests, live: the same public view you can give your customers.
Alerts in your network. Evaluated inside your own Poets.
Public status pages. Share a live dashboard without sharing access.
Kernel faults on the timeline. Memory errors, silent out-of-memory kills and disk errors, per node.
Flat CHF 5 per user account and month. Nothing per gigabyte, host or event.
Don't trust us: watch it yourself. Your Poet shows every connection and its bytes, peer to peer or to us. See how
Join the free pilot.
Expert help on your systems. Leave anytime: delete the Poet, one command.
Once we open to the public: two months free, then a flat CHF 5 per user account and month. How the pilot works ·
Security
Before Infinite Haiku had a datastore, a web app or a name anyone knew, it
had AGS: a renderer that turns measurements over time into shapes you can
fly through. This is how it grew, in six weeks of spring 2024, from one
badly centred colour into an interactive WebGPU tool. Origins, part 1 of 3.
An ugly first frame, and the right idea
Every monitoring product draws line charts. Line charts are fine for one
server. They are useless for a system: a cluster, its nodes, pods and
containers, or two hundred workers each running thousands of tasks. You
end up with a wall of squiggles and a guess.
AGS, the Area Graph on Steroids, started from a different question: what
if the whole system were one shape, the parts nested inside the whole, and
you could zoom into it like a map? The first version appeared on 21 April
2024. It was one flat colour, badly centred, and unmistakably a prototype.
It also proved the idea.
Getting time right
The first hard problem was time itself. Timestamps are 64-bit integers.
GPUs are built for 32-bit floating point, and splitting the value still
left enough error for shapes to overlap and shimmer.
The fix still shapes AGS today: exact time stays on the CPU, and the GPU
only ever sees values relative to the camera. Zoom from months down to
microseconds and the edges stay where they belong.
By the end of April, AGS could join measurements into continuous
segments, tell a real start or end from the edge of a request, pan and
zoom through time, fetch more data as you approach the edge of what is
loaded, reuse what it already had, and show hierarchy levels and the
relationships between elements.
Betting on the browser
In May the renderer moved into the browser. WebGL 2, the safe choice,
could not give the design the GPU storage it needed, so AGS committed to
WebGPU and Rust compiled to WebAssembly. In 2024 that was a bet. It meant
the same engine runs natively and in a browser tab, on the user’s own GPU,
with nothing to install.
Asking the GPU what you are pointing at
Interaction became part of the model. When you hover, AGS does not search
through the data: the GPU writes which element is under each pixel, and
AGS reads the answer back. Finding what is under the mouse does not get
slower as the picture gets denser.
Labels, metric switching, metadata filters and relationship highlights
followed in quick succession.
AGS also learned to choose its own time resolution: zoom out and it asks
for coarser data, zoom in and it asks for finer. That idea became the core
of today’s engine, where your Poet sends only the detail your current view
needs.
Why it matters to you
Six weeks in, AGS was not polished. It was something more useful: a real
exploration tool with a clean line between fetching data and drawing it.
That line is why AGS can draw half a million task intervals today at about
a millisecond of CPU per frame, and why the data it needs can stay small
enough to leave your network bill alone. The full story of that rebuild is
in Two and a half years of AGS.