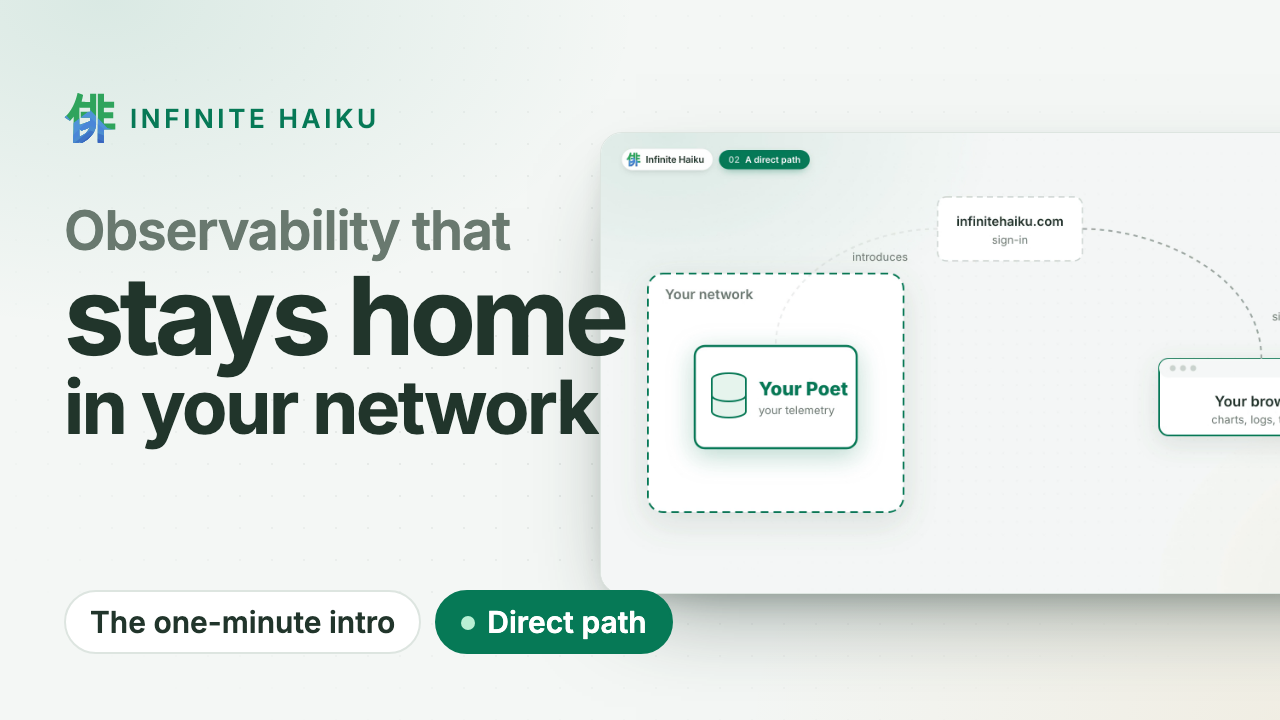
Metrics, logs and traces on one timeline, stored in your own cluster and read by your
browser directly. Your telemetry never passes through our servers.
OpenTelemetry in · Kubernetes · read-only MCP for your agents
Our own Poet, live
drag to zoom · double-click back
Reading our own Poet…
Your data stays home.
The datastore runs in your Kubernetes cluster or on your Linux machines. We sign you in and introduce your browser
to it; the data goes straight to you over an encrypted channel. No egress bill to ship telemetry
out, and nothing at our end to leak.
Walk into the timeline.
Every series of a service at once, drawn on your GPU. Zoom in and the detail follows; open a
request and see its log lines and the change behind it. Missing data is shown as missing, never
as zero.
Your agents investigate.
A read-only door (MCP) lets the coding agent you already use search, follow a request and read
the same numbers as your charts. No vendor AI, no per-investigation fee.
How it works
1A Poet in your cluster. Our datastore runs where your services run and
takes their OpenTelemetry. Read-only, one namespace.
2You sign in at infinitehaiku.com. Our web service checks who you are and
introduces your browser to your Poet. That is all it sees.
3Your browser talks to your Poet directly. An encrypted peer-to-peer
channel (WebRTC). The numbers never pass through our servers.
Infinite Haiku in one minute · plays from YouTube (youtube-nocookie.com)
Proof, not promises
Measured: 500,000 tasks from 200 workers over five hours, drawn at
1.1 ms of CPU per frame.
This site's own requests, live: the same public view you can give your customers.
Alerts in your network. Evaluated inside your own Poets.
Public status pages. Share a live dashboard without sharing access.
Kernel faults on the timeline. Memory errors, silent out-of-memory kills and disk errors, per node.
Flat CHF 5 per user account and month. Nothing per gigabyte, host or event.
Don't trust us: watch it yourself. Your Poet shows every connection and its bytes, peer to peer or to us. See how
Join the free pilot.
Expert help on your systems. Leave anytime: delete the Poet, one command.
Once we open to the public: two months free, then a flat CHF 5 per user account and month. How the pilot works ·
Security
Most observability products ship every measurement you produce to their
cloud, store it there and bill you for it, and your network bill charges
you again for the egress. In the summer of 2024 Infinite Haiku’s renderer
got a home, Kabuki, and a source of real data, Poet, designed the other
way round: it runs in your infrastructure, next to the systems it watches,
and hands the browser exactly what it needs to draw. Origins, part 2 of 3.
A home for the renderer
AGS could draw, but a canvas is not a product. On 2 June 2024 work started
on Kabuki, the web application around it, written in Rust with Leptos.
The first features were deliberately ordinary: a landing page, sign-up,
login and protected pages.
The interesting part was the boundary. The GPU’s event loop and the web
app’s reactive state had to live together in one browser tab, so AGS got
an interface that separates drawing from fetching data. A proof of concept
drew two graphs with linked time ranges: scroll one, and the other
follows. By the end of June, Kabuki could host AGS. What it lacked was
real data.
Why the datastore lives with you
Poet runs next to the system it watches, receives measurements there and
prepares exactly what the visualisation needs. You provide the compute. We
take on the job of making that compute small.
From generated data to a real model
Poet started in July with a small in-memory store and a plain web
interface, plus a generated data source to measure how fast it could
receive and answer. The model grew in layers:
element kinds describe the levels of a hierarchy, such as cluster,
node, pod and container;
elements have lifetimes, parents and metadata;
metrics hold what a source, which we call a Muse, observed;
relative metrics place each child continuously inside its parent, so
the parts always add up to the whole on screen;
haikus package the result for AGS.
Keeping the parts consistent with the whole is harder than it sounds. A
child’s value moves every sibling after it and can reveal that the parent
total does not match. Recomputing the whole tree for every update would
not scale, so Poet does the work incrementally.
More than one Poet
A datastore that lives in your infrastructure has to survive it. Over the
summer, Poets learned to find known peers, elect a leader, exchange
heartbeats, share out ranges of identifiers and find elements held by
another Poet. Tests ran two and three real Poet processes, killed leaders
and checked that the survivors carried on.
Why it matters to you
By the end of September 2024, Poet was a tested model with a working
coordination protocol, and a clear direction: the heavy lifting happens
next to your data, and only the result travels. Today Poet is a native
store for metrics, traces and logs that replicates between Poets and
reports what replication costs it. The principle has not changed.