Infinite Haiku shows what your systems are doing: metrics, logs, traces
and the changes behind them, on one timeline.
What it observes
- Your services, through OpenTelemetry (OTLP/HTTP): send what your
applications already emit (today to a Poet on a Linux
machine).
- Your infrastructure, through small collectors we call Muses: a
Kubernetes cluster, a Linux host and its kernel faults.
- How things relate: which pod runs on which node, which request called
which service. The views keep that context when you move between them.
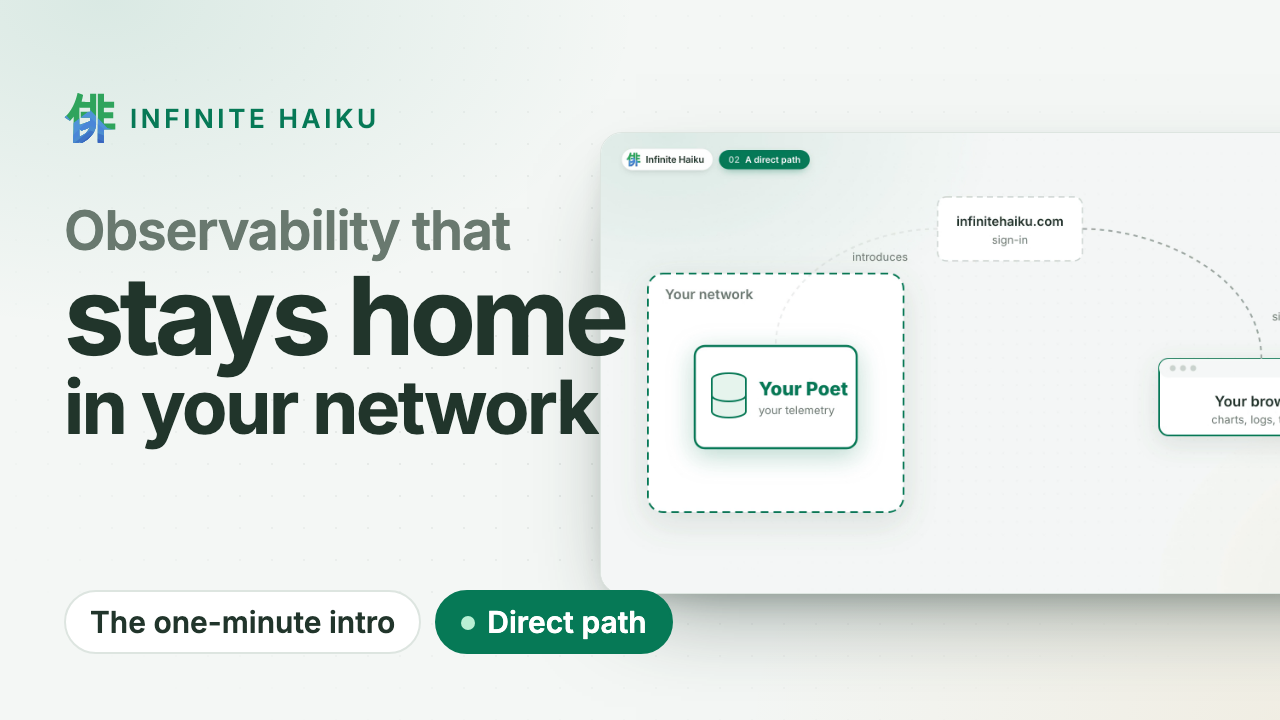
Your data stays with you
The datastore, the Poet, runs in your infrastructure: a Kubernetes
cluster or a Linux machine. Your telemetry is written there and stays there.
When you open a view, our web service signs you in and introduces your
browser to your Poets. From then on the data travels directly between
your Poet and your browser over an encrypted WebRTC channel. It never
passes through our servers, and you do not pay egress to ship it to us.
Several Poets can replicate each other, so a view stays available when one
of them is down.
The charts
The charts are drawn by our own GPU engine (WebGPU in the browser). It draws every series of a service at once as bands you can
enter: zoom in and the resolution follows, select a band and the others
step back, with the details beside it. The Poet computes every number; the
browser only draws them, so a chart, the API and an AI agent read the same
answer.
Agents included
AI agents investigate through a read-only door (MCP) that runs on your
machine and talks to your Poets the same direct way. It can search,
follow a request, and record what it found in an incident.
Next
Install a Poet where your data should live, on Kubernetes
or a Linux machine, and the Muses or OpenTelemetry senders that feed it. See Public dashboards for
sharing a view with people who do not sign in, and the blog for
how it is built.